PBstat
PBstat generates frequency and logo plots, and estimates something similar
to entropy called the equivalent number of PBs (Neq).
Note
The following examples require psi_md_traj_all.PB.count obtained with PBassign and then PBcount:
$ wget https://raw.githubusercontent.com/pierrepo/PBxplore/master/demo_doc/psi_md_traj_1.gro
$ wget https://raw.githubusercontent.com/pierrepo/PBxplore/master/demo_doc/psi_md_traj_1.xtc
$ PBassign -x psi_md_traj_1.xtc -g psi_md_traj_1.gro -o psi_md_traj_1
Frame 1/225.
Frame 100/225.
Frame 200/225.
Frame 225/225.
wrote psi_md_traj_1.PB.fasta

$ wget https://raw.githubusercontent.com/pierrepo/PBxplore/master/demo_doc/psi_md_traj_2.gro
$ wget https://raw.githubusercontent.com/pierrepo/PBxplore/master/demo_doc/psi_md_traj_2.xtc
$ PBassign -x psi_md_traj_2.xtc -g psi_md_traj_2.gro -o psi_md_traj_2
Frame 1/225.
Frame 100/225.
Frame 200/225.
Frame 225/225.
wrote psi_md_traj_2.PB.fasta

$ PBcount -f psi_md_traj_1.PB.fasta -f psi_md_traj_2.PB.fasta -o psi_md_traj_all
read 225 sequences in psi_md_traj_1.PB.fasta
read 225 sequences in psi_md_traj_2.PB.fasta
wrote psi_md_traj_all.PB.count
Warning
To generate Weblogo-like representations, Weblogo3 is required.
If needed, you can download [psi_md_traj_all.PB.count](https://raw.githubusercontent.com/pierrepo/PBxplore/master/demo_doc/psi_md_traj_all.PB.count).
Example
$ PBstat -f psi_md_traj_all.PB.count --map --neq --logo -o psi_md_traj_all
Index of first residue in psi_md_traj_all.PB.count is 1
First residue in the output file(s) is 1
wrote psi_md_traj_all.PB.map.png
wrote psi_md_traj_all.PB.Neq
wrote psi_md_traj_all.PB.Neq.png
wrote psi_md_traj_all.PB.logo.png
Usage
Here’s the PBstat help text.
usage: PBstat [-h] -f F -o O [--map] [--neq] [--logo]
              [--image-format {pdf,png,jpg}] [--residue-min RESIDUE_MIN]
              [--residue-max RESIDUE_MAX]

Statistical analysis and graphical representations of PBs.

optional arguments:
  -h, --help            show this help message and exit
  -f F                  name of file that contains PBs frequency (count)
  -o O                  name for results
  --map                 generate map of the distribution of PBs along protein
                        sequence
  --neq                 compute Neq and generate Neq plot along protein
                        sequence
  --logo                generate logo representation of PBs frequency along
                        protein sequence
  --image-format {pdf,png,jpg}
                        File format for all image output.
  --residue-min RESIDUE_MIN
                        defines lower bound of residue frame
  --residue-max RESIDUE_MAX
                        defines upper bound of residue frame
  -v, --version         show program's version number and exit
–map option
generates map of the distribution of PBs along protein sequence.
$ PBstat -f psi_md_traj_all.PB.count --map -o psi_md_traj_all
Index of first residue in psi_md_traj_all.PB.count is 1
First residue in the output file(s) is 1
wrote psi_md_traj_all.PB.map.png
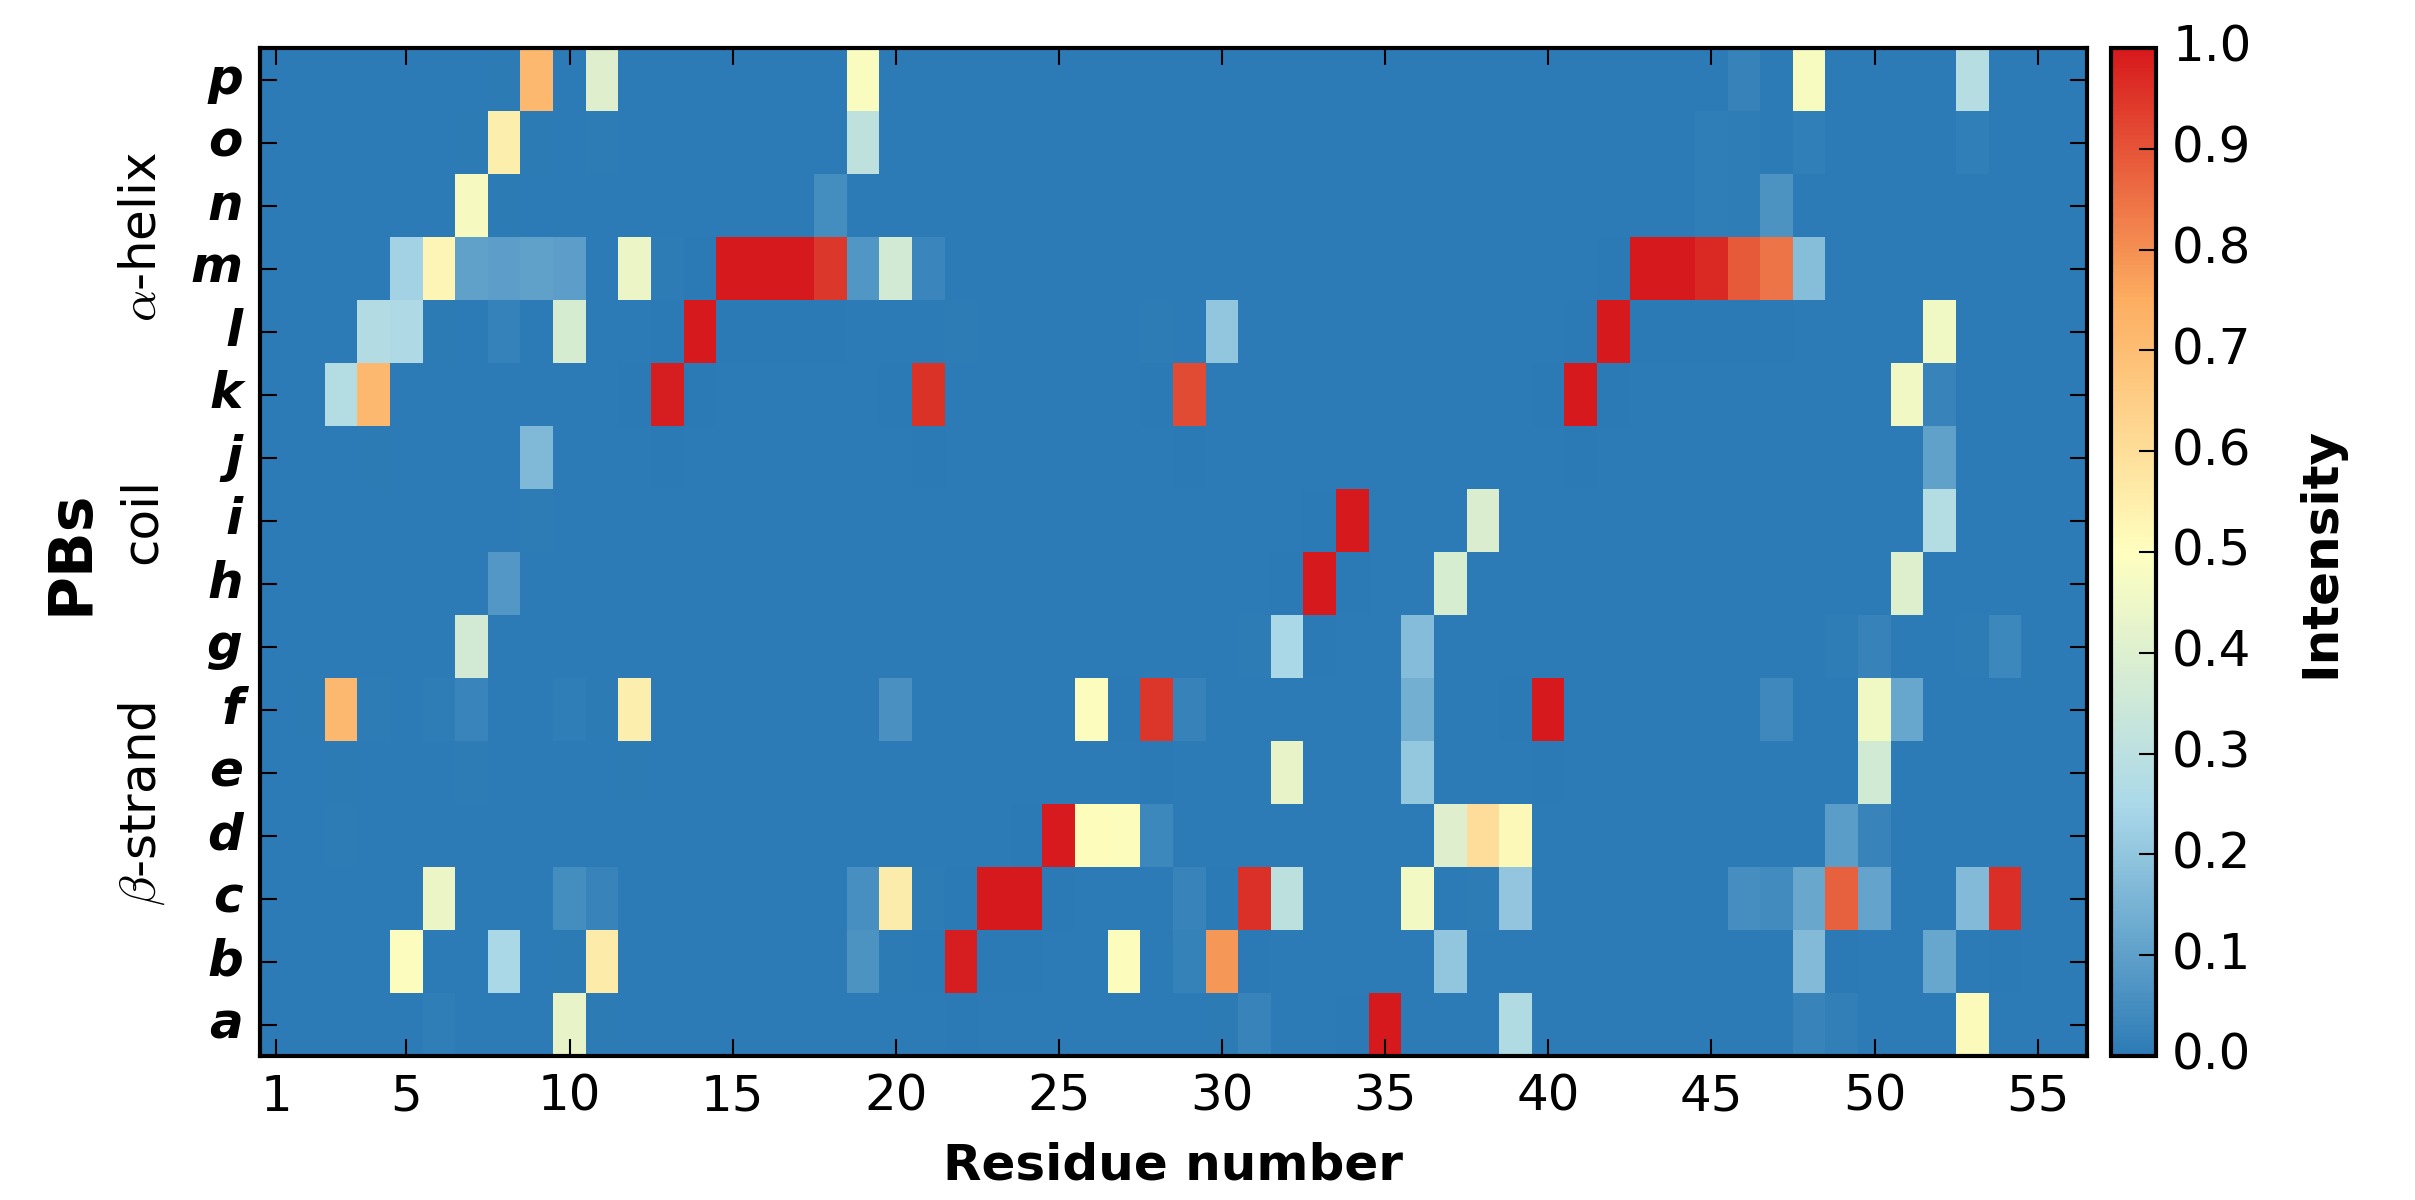
Distribution of PBs
The color range goes from red to blue. For a given position in the protein sequence, blue corresponds to a null frequency (meaning the particular PB is never met a this position) and red corresponds to a frequency of 1 (meaning the particular PB is always found at this position).
–neq option
computes Neq and generates Neq plot along protein sequence.
$ PBstat -f psi_md_traj_all.PB.count --neq -o psi_md_traj_all
Index of first residue in psi_md_traj_all.PB.count is 1
First residue in the output file(s) is 1
wrote psi_md_traj_all.PB.Neq
wrote psi_md_traj_all.PB.Neq.png
Content of psi_md_traj_all.PB.Neq:
resid       Neq
1          1.00
2          1.00
3          1.90
4          1.91
5          2.87
6          2.30
[snip]
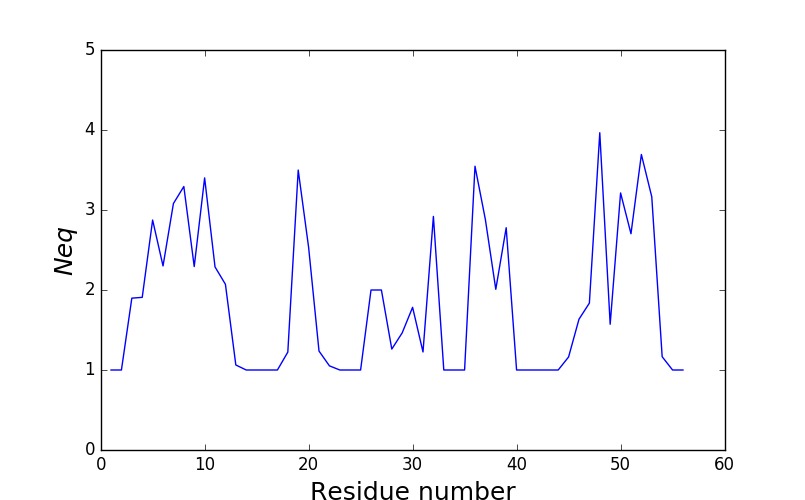
Neq versus residue number
–logo option
generates WebLogo-like representation of PBs frequency along protein sequence.
Warning
This option requires Weblogo3.
$ PBstat -f psi_md_traj_all.PB.count --logo -o psi_md_traj_all
Index of first residue is: 1
wrote psi_md_traj_all.PB.logo.png
Logo representation of PBs frequency
–residue-min and –residue-max options
These options define the lower and upper bound of residue frame.
$ PBstat -f psi_md_traj_all.PB.count --map --neq --logo -o psi_md_traj_all_frame --residue-min 15 --residue-max 42
Index of first residue in psi_md_traj_all.PB.count is 1
First residue in the output file(s) is 15
wrote psi_md_traj_all_frame.PB.map.15-42.png
wrote psi_md_traj_all_frame.PB.Neq.15-42
wrote psi_md_traj_all_frame.PB.Neq.15-42.png
wrote psi_md_traj_all_frame.PB.logo.15-42.png
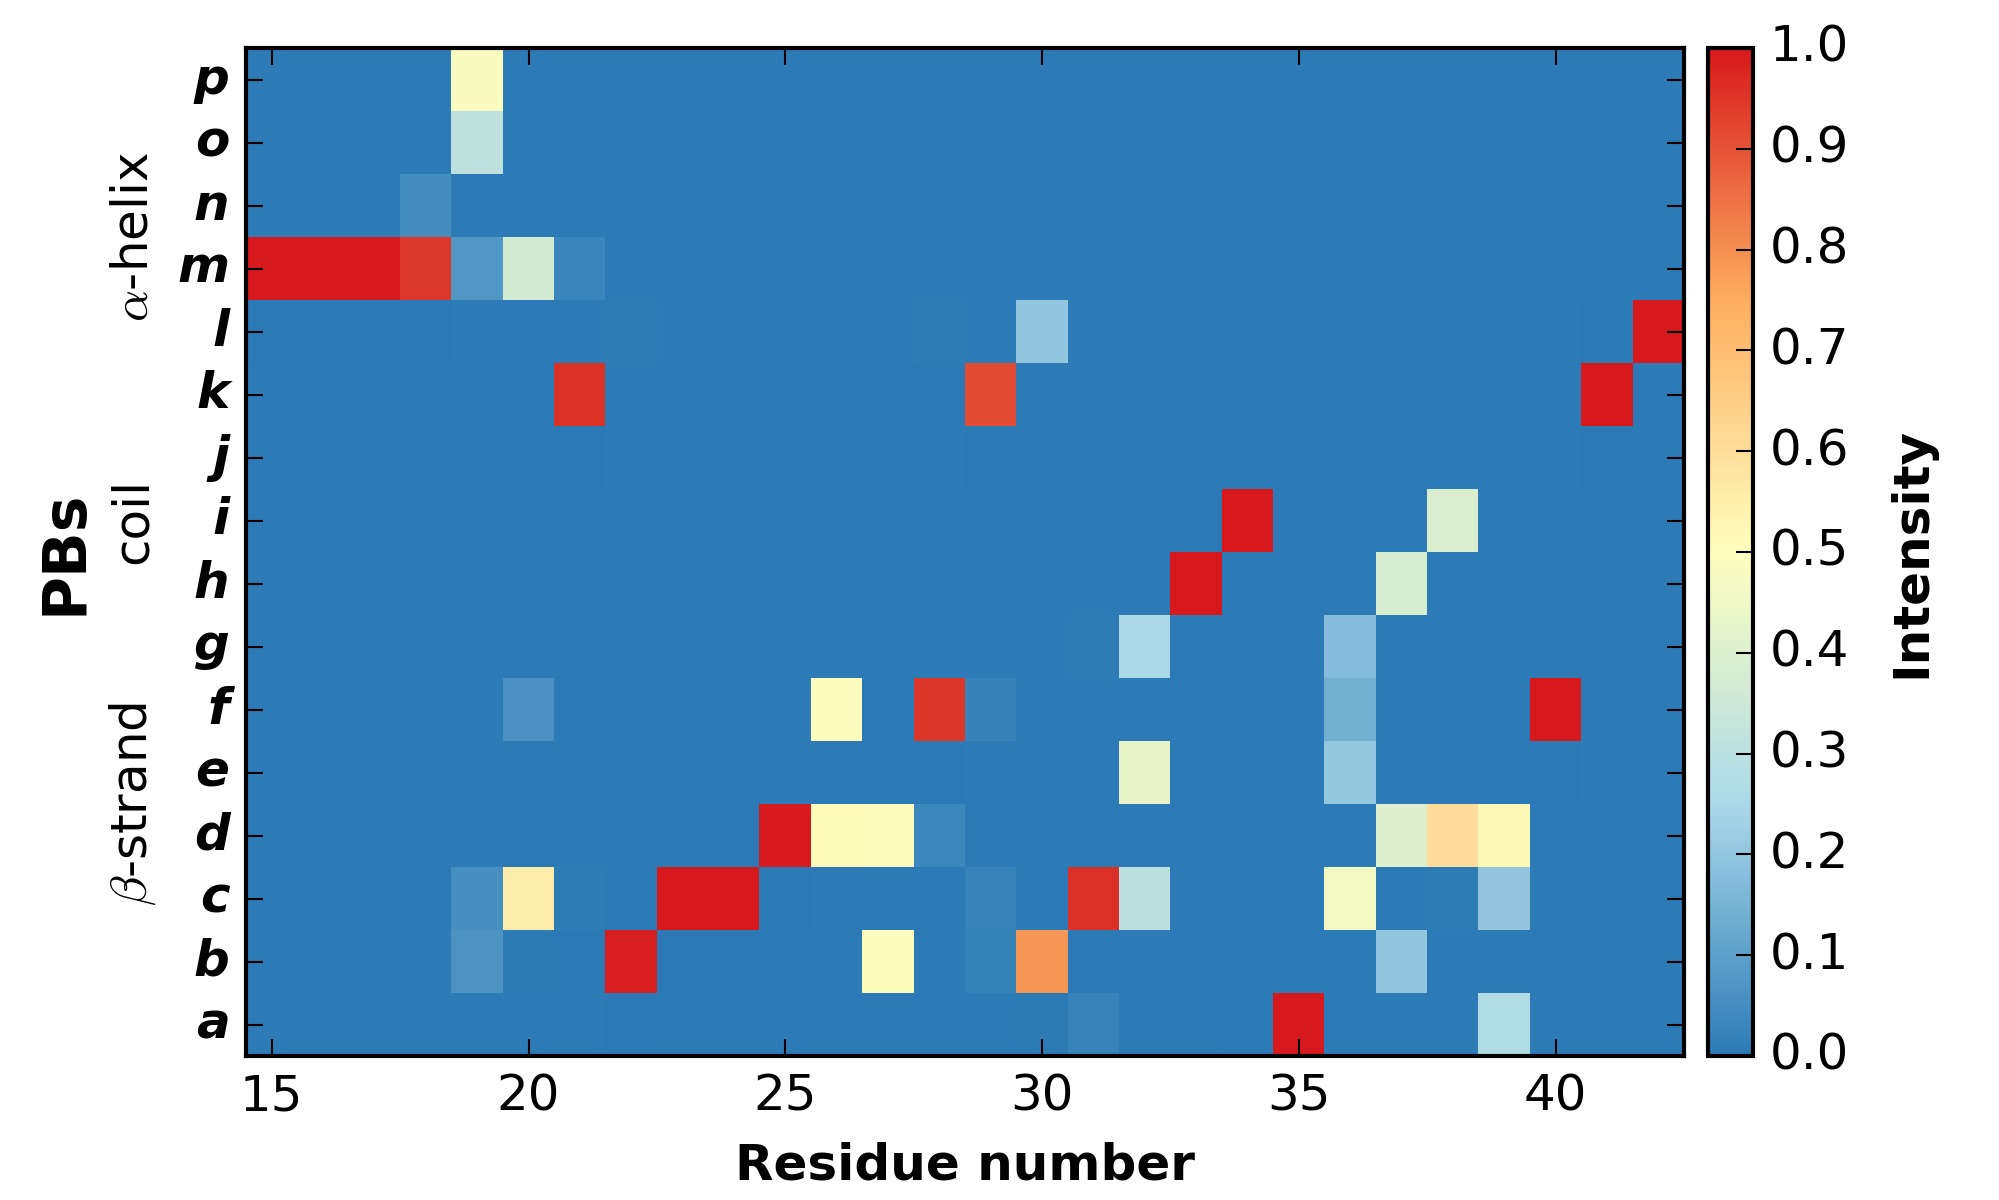
PBs distribution with residue frame
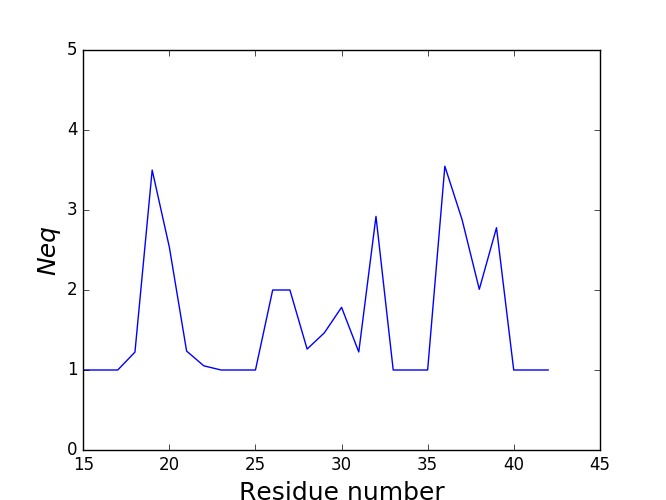
Neq versus residue number with residue frame
Logo representation of PBs frequency
–image-format option
All figure can be produced in either PNG, PDF, or JPEG format. The –image-format option allows to control the file format of the image outputs.